Screenshotting Excel Copilot and Python in Excel
By Celtrim · Updated
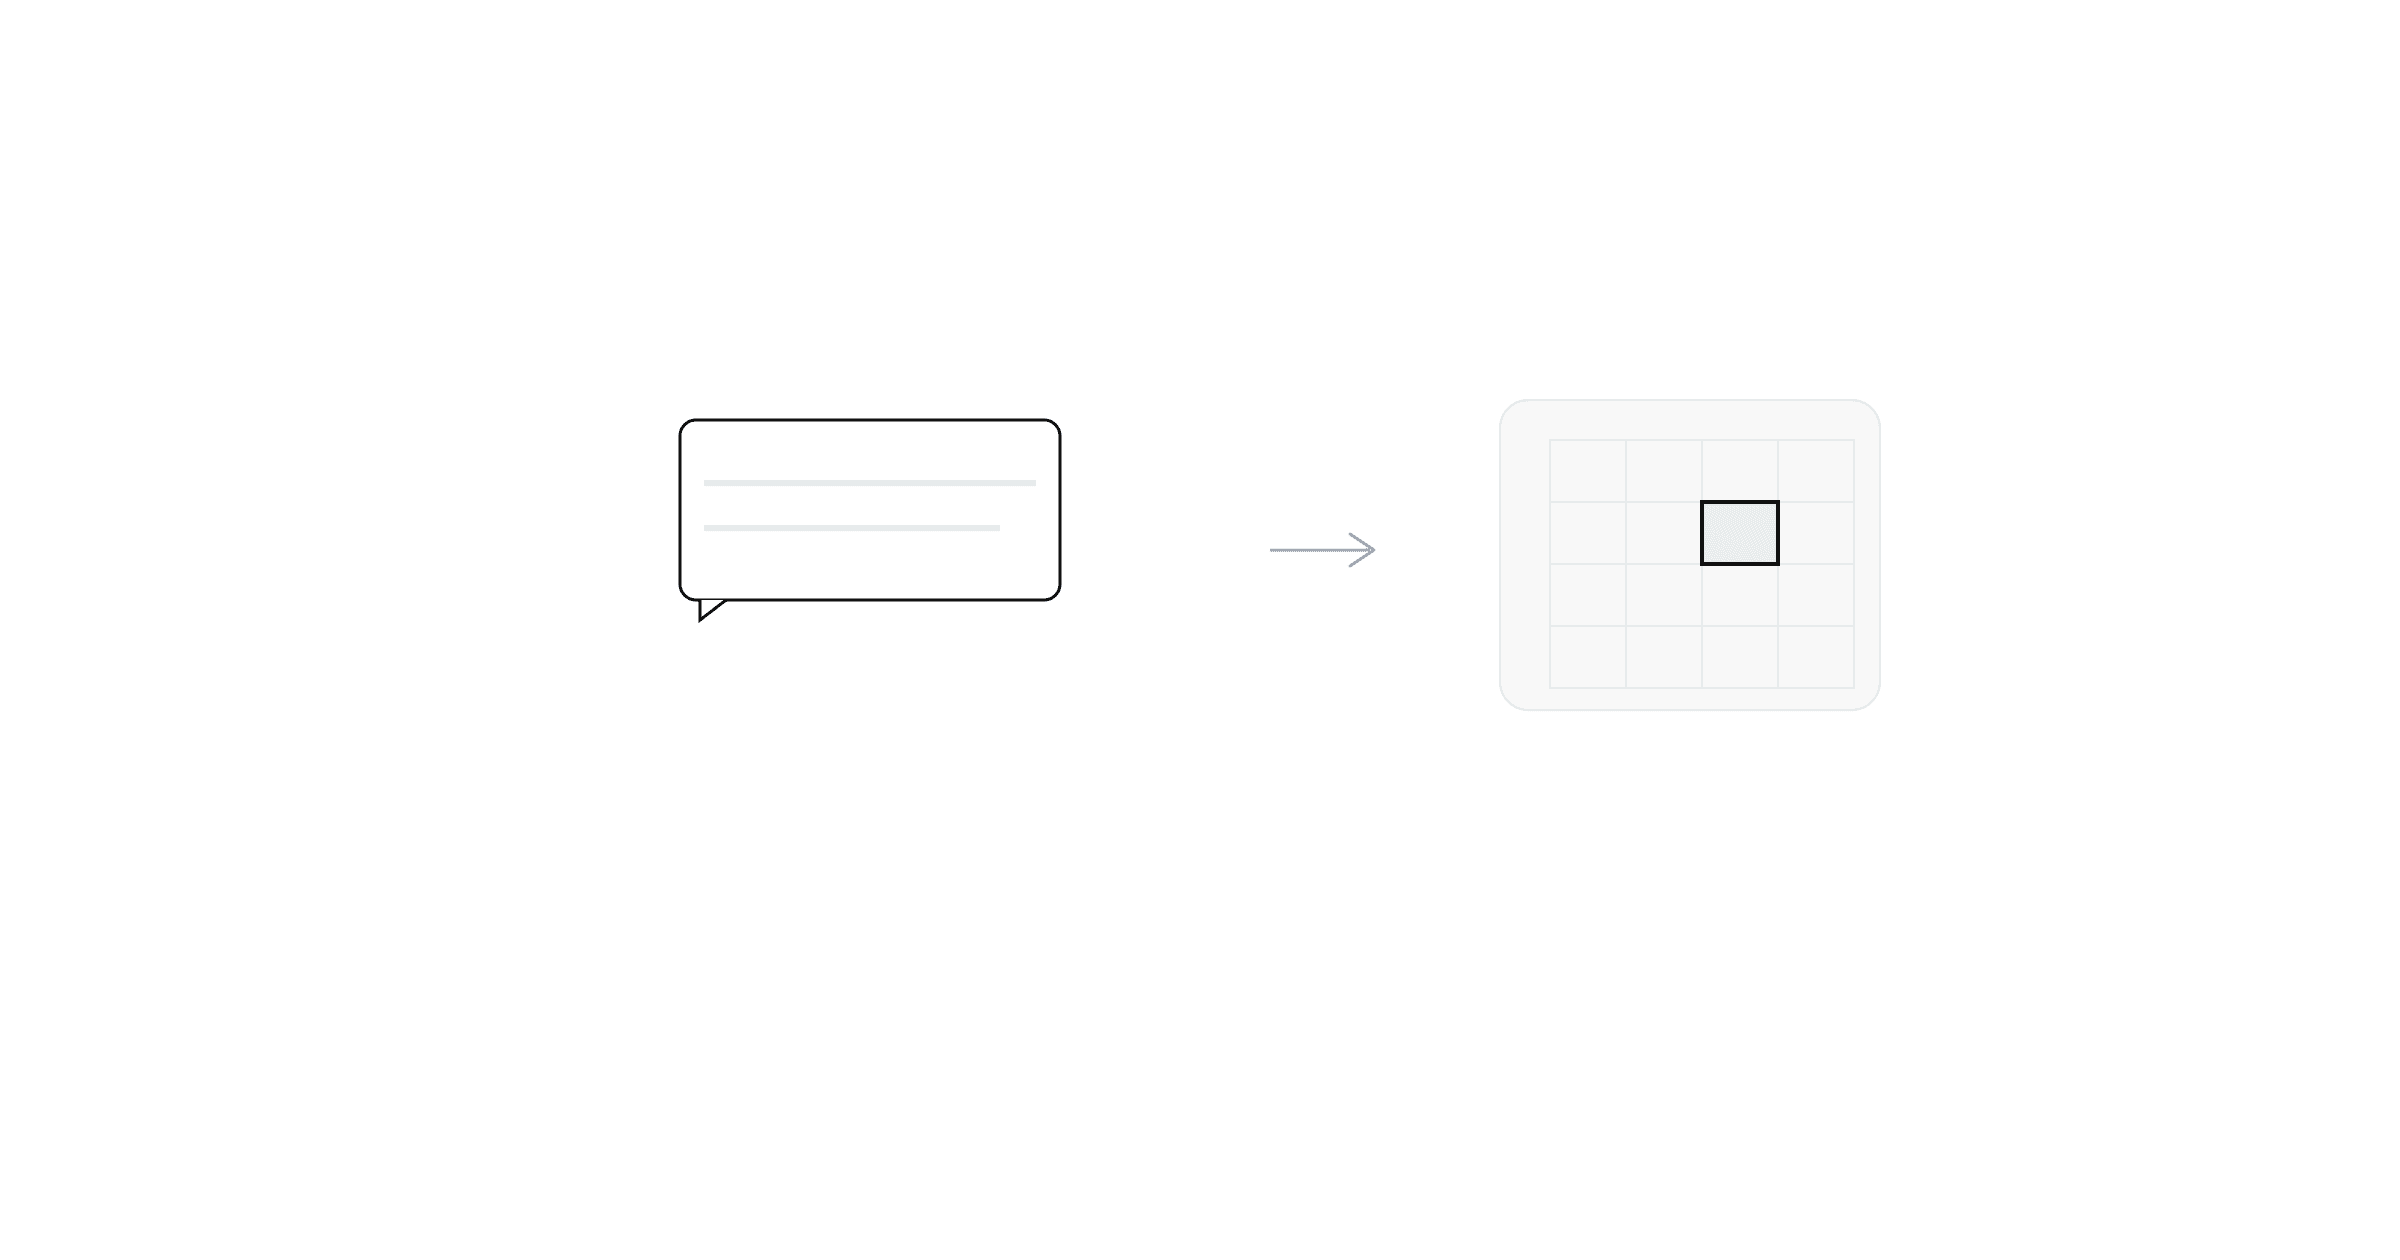
Excel's newer AI features live in their own panels rather than in worksheet cells, which changes what "screenshotting Excel" actually means. Copilot's chat sits in a sidebar, agent mode runs as a background task with its own status log, and Python in Excel puts code and output side by side in a single cell. None of these are ordinary data ranges, so the approach is different for each.
Copilot's chat pane
Copilot in Excel (part of Microsoft 365 Copilot, and shared with the same chat pattern in Word) opens as a sidebar next to the worksheet, not inside it. If you want to show a colleague what Copilot suggested — a formula it wrote, an insight it summarized, a chart it proposed — that's the chat pane itself, plus maybe the cell or range it's referencing. There's no way to export that pane as worksheet data, since it isn't worksheet data: it's a conversation transcript. A normal OS screenshot (Cmd+Shift+4 on Mac, Win+Shift+S on Windows) of the sidebar, cropped to include the relevant reply, is the right tool here.
If Copilot's output lands in the sheet — it writes a formula into a cell, or fills a column — that part becomes ordinary worksheet data once it's there, and can be screenshotted as a normal range like anything else.
Agent mode
Agent mode runs multi-step tasks in the background and reports progress in its own status view rather than editing the sheet interactively in front of you. Screenshotting the agent's plan or step log means capturing that status panel — again a UI screenshot, not a data export. Once the agent finishes and the results are sitting in cells, the same logic as above applies: at that point it's just a worksheet, and a values-only export works fine.
Python in Excel
Python in Excel cells display differently depending on the returned object: a scalar value looks like a normal cell, but a DataFrame or plot renders as a special "Python object" preview inside the cell, which expands into a card when you click it. A plain screenshot of a collapsed Python cell just shows a small icon, not the actual output — you need to expand the card first (click the cell, then the expand icon) before capturing it. Plots specifically only exist as a rendered image inside that card; there's no underlying pixel data to extract the way there is for a numeric cell.
What this means in practice
For chat panels, agent status, and rendered plots, a native OS screenshot of the visible UI is the only option — these aren't worksheet values, so no data-export tool (including Celtrim) can substitute for capturing the pixels on screen. But once any of these features write a plain number or table back into the grid — a formula Copilot suggested, a summary table an agent produced, a scalar result from a Python cell — that output is ordinary worksheet data again, and can be screenshotted the same clean way as any other range: select it, export a PNG, done.